
There are a lot of excellent databases out there. Almost all databases can support time tagged information and if you have regularly sampled data everything works well. However if you have irregularly sampled data things can get a little more challenging.
InfluxDB is an open-source time series database (TSDB). It is written in Go and optimized for fast, high-availability storage and retrieval of time series data in fields such as operations monitoring, application metrics, Internet of Things sensor data, and real-time analytics.
InfluxDB has a number of great features:
- when data is added, a time stamp is automatically added if it’s already incluced.
- InfluxDB manages aggregation of times (i.e. means over the hour)
- Open Source Web Trending packages like Grafana and Chronograf will talk directly to InfluxDB
- an SQL language with a time based syntax
In this blog I wanted to document my notes on:
- How to add sampled data from Node-Red to Influx
- How to view Influx historical data in a Node-Red chart
Why Use Node-Red with Influx
With the great Web trending interfaces like Grafana and Chronograf why use Node-Red?
- I really like Grafana, but I didn’t find it to be 100% mobile friendly, whereas Node-Red is designed for mobile use.
- if you’re inputting data or doing logic in Node-Red it makes sense to keep the interface logic there also.
The downside of using Node-Red is that you will have to make your own charting controls.
Getting Started with InfluxDB
The official installation document lists the various options based on your OS. For a simple Raspberry Pi or Ubuntu installation I used:
sudo apt-get install influxdb
The influxdb configuration/setup is modified by:
sudo nano /etc/influxdb/influxdb.conf
After configuration changes Influx can be restarted by:
sudo service influx restart
The Influx command line interface (CLI) is useful for getting started and checking queries. It is started by entering: influx (Note: it might be slow to initially come up).
Below I’ve opened the influx CLI and created a new database called nrdb.
~$ influx
Connected to http://localhost:8086 version 1.7.9
InfluxDB shell version: 1.7.9
> create database nrdb
> show databases
name: databases
name
----
_internal
pidata
nrdb
>
Node-Red and Influx
Node-Red is pre-installed on Raspberry Pi. If you need to install Node-Red on a Window, MacOS or Linux node see the installation instructions.
For my testing I used the following definitions:
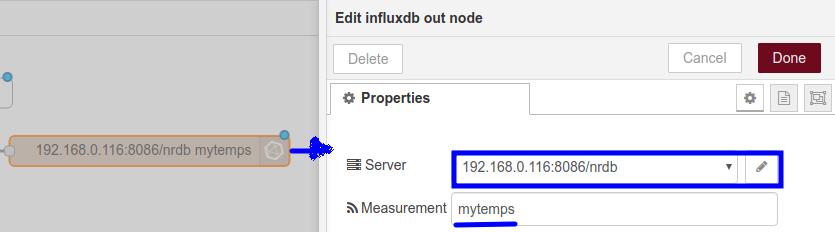
- nrdb – the InfluxDB database
- mytemps – the measurement variable for my temperatures
- Burlington, Hamilton – two locations for the temperatures
- temperatures – the actual temperatures
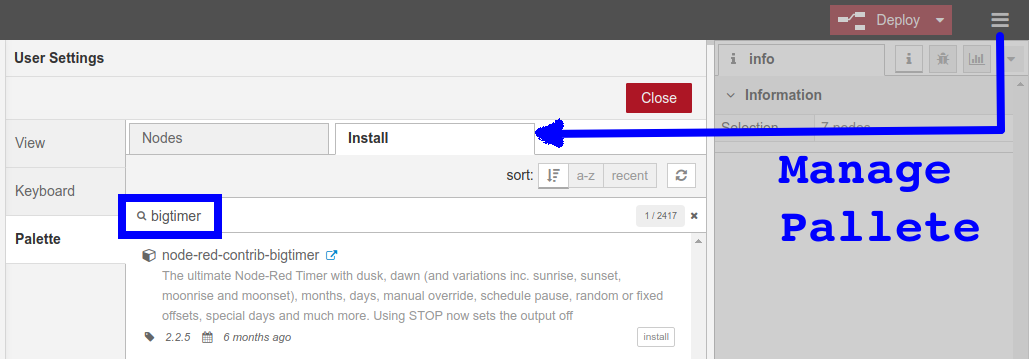
Two Node-Red libraries were installed:
- BigTimer – https://flows.nodered.org/node/node-red-contrib-bigtimer
- InfluxDB – https://flows.nodered.org/node/node-red-contrib-influxdb
These libraries can either be installed using npm or within Node-Red using the “Manage Pallet” option.
For this project I create two sets of logic. The first set used the BigTimer to write a new simulated input every minute (via the middle output pin of BigTimer), or manual push in a value. The second part of the logic used a selected time to query the data and present it to a chart and table.
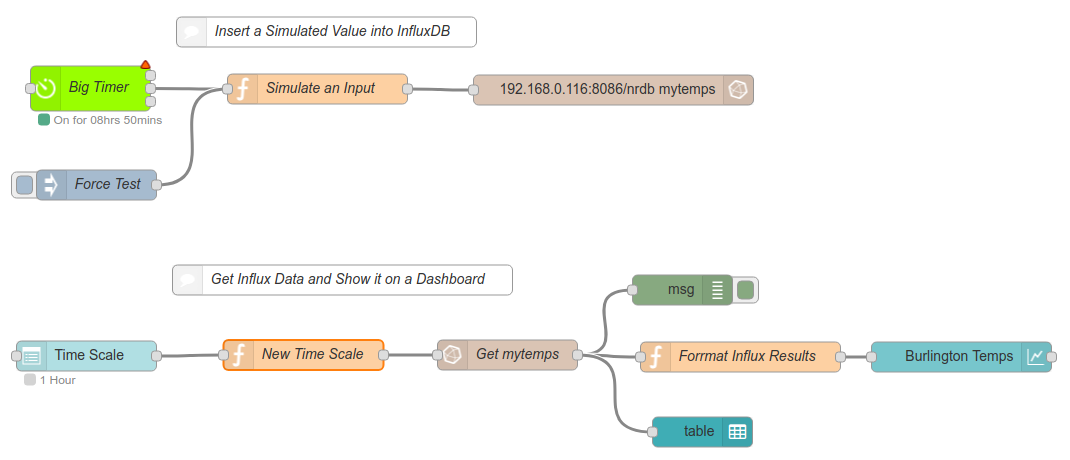
The first step is to drop a InfluxDB outpt and then configure the Influx server, table and measurements.
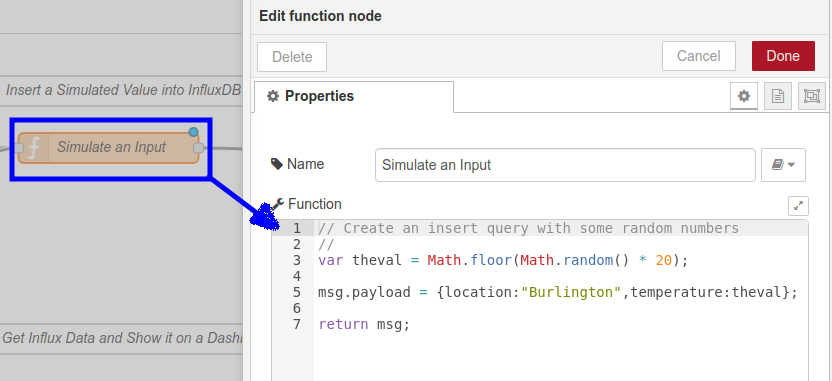
A Javascript function node (“Simulate an Input”) is used to format the fields and values. The first passed item is the key item, and the second parameter is a tagged value. Note: there are a number of different ways to use this node.
The Big Timer middle output will send a value out every minute. I added an Inject Node (“Force Test”) so I could see more values.
To test that things are running, the influx cli can be used:
> use nrdb
Using database nrdb
> show measurements
name: measurements
name
----
mytemps
> select * from mytemps
name: mytemps
time location temperature
---- -------- -----------
1580584703785817412 Burlington 17
1580584706364427345 Burlington 5
1580584761862704310 Burlington 8
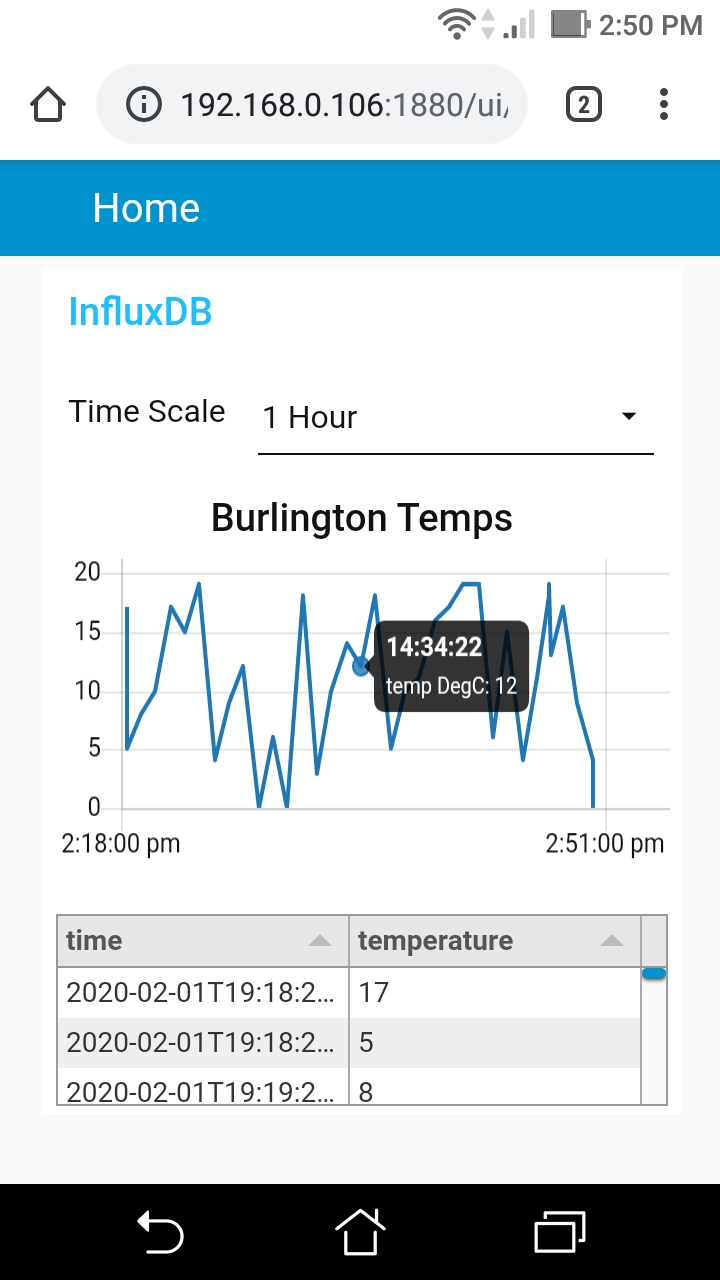
Show Influx Data in a Node-Red Dashboard
For a simple Dashboard I wanted to use a dropdown node (as a time selector), a chart and a table.
The drop down node has a selection of different times.
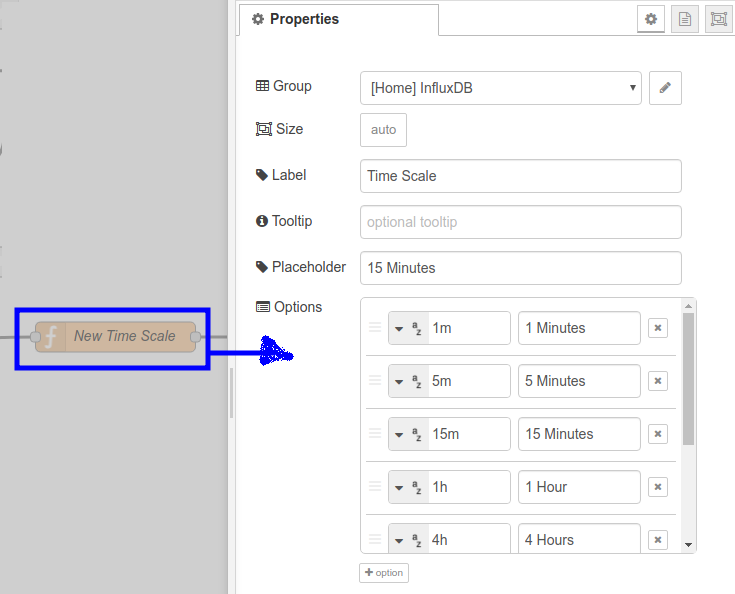
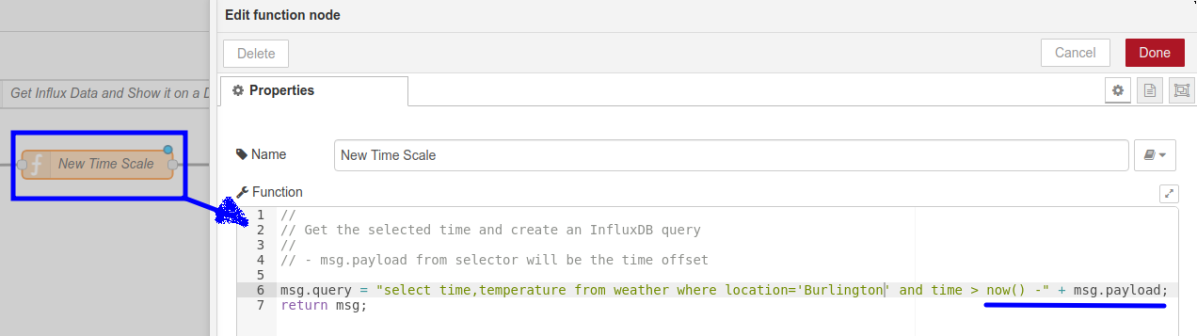
The payload from the dropdown node would be something like: 1m, 5m, 15m. A Javascript function node (“New Time Scale”) used this payload and created an InfluxDB query.
This syntax can be tested in the influx cli:
> select time,temperature from mytemps where location='Burlington' and time > now() - 5m
name: mytemps
time temperature
---- -----------
1580588829859372644 12
1580588889896729245 6
1580588949931621672 17
1580589009972333308 8
1580589069980649689 12
The InfluxDB input node only has the InfluxDB server information. The query is passed in from the Javascript function node (“New Time Scale”) .
A Javascript function node (“Javascript function node (“Format Influx Results”) is used to put the msg.payload into a format that the chart node can use.
// // Format the InfluxDB results to match the charts JSON format // var series = ["temp DegC"]; var labels = ["Data Values"]; var data = "[["; var thetime; for (var i=0; i < msg.payload.length; i++) { thetime = Number(msg.payload[i].time); // Some manipulation of the time may be required data += '{ "x":' + thetime + ', "y":' + msg.payload[i].temperature + '}'; if (i < (msg.payload.length - 1)) { data += "," } else { data += "]]" } } var jsondata = JSON.parse(data); msg.payload = [{"series": series, "data": jsondata, "labels": labels}]; return msg;Once all the logic has been updated, click on the Deploy button. The Node-Red dashboard can be accessed at: http://node-red_ip:1880/ui. Below is an example:
Final Comments
This project was not 100% there are still some cleanup items to do, such as:
- use real I/O
- make the times a little cleaner in the table
- a better time selections for the chart.
Also to better explain things I only used 1 location but multiple data points could be inserted, queried and charted.

“The drop down node” has wrong Node snapshot….
LikeLike
On “Format Influx Results”, line-21, is written “msg.playload = data;”…. (“play”…. ???)
LikeLike
Thanks for catching that. I corrected the page.
LikeLike
Hey!
Thanks for this tutorial it was really helpful.
As I followed the instructions I noticed some missing/wrong informations:
– As a fresh install node-red doesnt have the dashboard node so the newbies should install it as well.
– The function node : “Format Influx Results” js code shouldn’t contain the ,,msg.payload = data;” line (line 21). I debugged to get over it about an hour 😀
– You missed the bigtimer’s configuration and many details on multiple items
LikeLike
Hey thanks for comments and feedback.I apologize sometimes I get a litt
LikeLike
Hello sir, thanks for the good work you done. May I ask your help I have a problem with the (Format the InfluxDB results node) it show actully 3 errors and could not deploy the flow like for example (
for (var i=0; i < msg.payload.length; i++)) I don’t think this code is right (for statement )take 3 parameter but in your code it has 4! also i got error in this section of the code ( if (i < (msg.payload.length – 1)) {
data += “,”
} else {
data += “]]”
}}
where is the condition ??
Please cloud you rewrite the code again because it dose not deploy to node red
thanks in advance
LikeLike
I mange to solve the error message I got it in your code but and mange also tp deploy the flow ,, and got only this error in the debug node(TypeError: Cannot read property ‘time’ of undefined) could you please help me .
LikeLike
Hi, can you share the fow? thanks
LikeLike
Hi,Unfortunately we had a power surge and my Rasp Pi wasn’t plugged into our surge suppressor. I’m still trying to getting things back. Pete
LikeLike
Hi, great manual, many thanks. Your function was broken so I tried to correct it. Here is my repair.
//
// Format the InfluxDB results to match the charts JSON format
//
var series = global.get(“Graf”);
var labels = [“Data Values”];
var data = “[“;
var thetime;
for (var i=0; i < msg.payload.length; i++) {
thetime = Number(msg.payload[i].time); // Some manipulation of the time may be required
data += '{ "x":' + thetime + ', "y":' + msg.payload[i].value + '}';
if (i < (msg.payload.length – 1)) {
data += ","
} else {
data += "]"
}
}
var jsondata = JSON.parse(data);
msg.payload = [{"series": [series], "data": [jsondata], "labels": labels}];
//msg.payload = data;
return msg;
LikeLike
And for easier implementation here is my flow – I added the possibility of changing the input data for graph.
[{“id”:”aec81712.e94938″,”type”:”tab”,”label”:”Chart”,”disabled”:false,”info”:””},{“id”:”1d747478.a70a3c”,”type”:”ui_dropdown”,”z”:”aec81712.e94938″,”name”:””,”label”:”Rozpětí”,”tooltip”:””,”place”:”Select option”,”group”:”6da8e969.ae2c18″,”order”:1,”width”:0,”height”:0,”passthru”:true,”multiple”:false,”options”:[{“label”:”1 Minuta”,”value”:”10m”,”type”:”str”},{“label”:”45 Minut”,”value”:”45m”,”type”:”str”},{“label”:”1 Hodina”,”value”:”1h”,”type”:”str”},{“label”:”24 Hodin”,”value”:”24h”,”type”:”str”},{“label”:”1 den”,”value”:”1d”,”type”:”str”},{“label”:”2 dny”,”value”:”2d”,”type”:”str”},{“label”:”3 dny”,”value”:”3d”,”type”:”str”},{“label”:”7 dní”,”value”:”7d”,”type”:”str”},{“label”:”28 dní”,”value”:”28d”,”type”:”str”}],”payload”:””,”topic”:””,”x”:130,”y”:240,”wires”:[[“a8c01471.ced5c8″,”18f1281.19f48d8”]]},{“id”:”a8c01471.ced5c8″,”type”:”function”,”z”:”aec81712.e94938″,”name”:””,”func”:”var graf = global.get(\”Graf\”);\n\n\nmsg.query = \”select time,\”+ graf+\” from xiaomi WHERE time > now() -\” + msg.payload;\nreturn msg;”,”outputs”:1,”noerr”:0,”initialize”:””,”finalize”:””,”x”:280,”y”:240,”wires”:[[“4bca8937.9bb208”]]},{“id”:”4bca8937.9bb208″,”type”:”influxdb in”,”z”:”aec81712.e94938″,”influxdb”:”dd090ea0.54c55″,”name”:”Xiaomi”,”query”:””,”rawOutput”:false,”precision”:””,”retentionPolicy”:””,”org”:”organisation”,”x”:410,”y”:240,”wires”:[[“d14a2855.5e3cf8”]]},{“id”:”8c90f757.87ba68″,”type”:”function”,”z”:”aec81712.e94938″,”name”:””,”func”:”//\n// Format the InfluxDB results to match the charts JSON format\n//\nvar series = global.get(\”Graf\”);\nvar labels = [\”Data Values\”];\nvar data = \”[\”;\nvar thetime;\n\nfor (var i=0; i < msg.payload.length; i++) {\n thetime = Number(msg.payload[i].time); // Some manipulation of the time may be required\n data += '{ \"x\":' + thetime + ', \"y\":' + msg.payload[i].value + '}';\n if (i < (msg.payload.length – 1)) {\n data += \",\"\n } else {\n data += \"]\"\n }\n}\nvar jsondata = JSON.parse(data);\nmsg.payload = [{\"series\": [series], \"data\": [jsondata], \"labels\": labels}];\n//msg.payload = data;\nreturn msg;","outputs":1,"noerr":0,"initialize":"","finalize":"","x":720,"y":320,"wires":[["f9137346.2a8a5"]]},{"id":"f9137346.2a8a5","type":"ui_chart","z":"aec81712.e94938","name":"","group":"6da8e969.ae2c18","order":1,"width":"6","height":"4","label":"","chartType":"line","legend":"false","xformat":"dd HH:mm","interpolate":"cubic","nodata":"","dot":false,"ymin":"","ymax":"","removeOlder":1,"removeOlderPoints":"","removeOlderUnit":"60","cutout":0,"useOneColor":false,"useUTC":false,"colors":["#ff0000","#aec7e8","#ff7f0e","#2ca02c","#98df8a","#ff0000","#ff9896","#9467bd","#c5b0d5"],"outputs":1,"useDifferentColor":false,"x":850,"y":320,"wires":[[]]},{"id":"d14a2855.5e3cf8","type":"split","z":"aec81712.e94938","name":"","splt":"\\n","spltType":"str","arraySplt":1,"arraySpltType":"len","stream":false,"addname":"","x":590,"y":160,"wires":[["9d09ba8c.43cee8"]]},{"id":"9d09ba8c.43cee8","type":"split","z":"aec81712.e94938","name":"","splt":"\\n","spltType":"str","arraySplt":1,"arraySpltType":"len","stream":false,"addname":"","x":590,"y":200,"wires":[["9b4e3bfa.af55b8"]]},{"id":"1c9ba47a.02982c","type":"join","z":"aec81712.e94938","name":"","mode":"custom","build":"merged","property":"payload","propertyType":"msg","key":"topic","joiner":"\\n","joinerType":"str","accumulate":false,"timeout":"","count":"","reduceRight":false,"reduceExp":"","reduceInit":"","reduceInitType":"","reduceFixup":"","x":590,"y":280,"wires":[["15032d36.6ca513"]]},{"id":"9b4e3bfa.af55b8","type":"function","z":"aec81712.e94938","name":"","func":"var data = msg.payload;\nif (typeof msg.payload === 'number') {\nmsg.payload =\n{value: data}\nreturn msg\n\n} \n\nelse {\nmsg.payload =\n{time: data}\n return msg\n}\n","outputs":1,"noerr":0,"initialize":"","finalize":"","x":600,"y":240,"wires":[["1c9ba47a.02982c"]]},{"id":"15032d36.6ca513","type":"join","z":"aec81712.e94938","name":"","mode":"auto","build":"string","property":"payload","propertyType":"msg","key":"topic","joiner":"\\n","joinerType":"str","accumulate":"false","timeout":"","count":"","reduceRight":false,"x":590,"y":320,"wires":[["8c90f757.87ba68"]]},{"id":"f93ade6c.b8baa","type":"ui_dropdown","z":"aec81712.e94938","name":"","label":"Data","tooltip":"","place":"Select option","group":"6da8e969.ae2c18","order":1,"width":0,"height":0,"passthru":true,"multiple":false,"options":[{"label":"Teplota1","value":"temp1","type":"str"},{"label":"Teplota2","value":"temp2","type":"str"},{"label":"Vlhkost1","value":"hum1","type":"str"},{"label":"Vlhkost2","value":"hum2","type":"str"}],"payload":"","topic":"","x":130,"y":200,"wires":[["973ac92c.b613d8","1c1d67d5.22eb88"]]},{"id":"973ac92c.b613d8","type":"change","z":"aec81712.e94938","name":"","rules":[{"t":"set","p":"Graf","pt":"global","to":"payload","tot":"msg"}],"action":"","property":"","from":"","to":"","reg":false,"x":300,"y":200,"wires":[[]]},{"id":"1c1d67d5.22eb88","type":"change","z":"aec81712.e94938","name":"","rules":[{"t":"set","p":"payload","pt":"msg","to":"Rozpeti","tot":"global"}],"action":"","property":"","from":"","to":"","reg":false,"x":240,"y":100,"wires":[["1d747478.a70a3c"]]},{"id":"18f1281.19f48d8","type":"change","z":"aec81712.e94938","name":"","rules":[{"t":"set","p":"Rozpeti","pt":"global","to":"payload","tot":"msg"}],"action":"","property":"","from":"","to":"","reg":false,"x":310,"y":280,"wires":[[]]},{"id":"6da8e969.ae2c18","type":"ui_group","name":"Graf","tab":"aa83e694.8c85d8","order":1,"disp":true,"width":"6","collapse":true},{"id":"dd090ea0.54c55","type":"influxdb","hostname":"192.168.0.101","port":"8086","protocol":"http","database":"home","name":"Influx","usetls":false,"tls":"","influxdbVersion":"1.x","url":"http://localhost:8086","rejectUnauthorized":true},{"id":"aa83e694.8c85d8","type":"ui_tab","name":"GRAF","icon":"timeline","order":2,"disabled":false,"hidden":false}]
LikeLike
Hi Pavel,
Thank you very much for sharing your code. Really appreciate it. All the best. Pete
LikeLike
Hello Pavel
and thanks for sharing your code.
Hope you can help me. If i try to import your flow, i get an error:
SyntaxError: Unexpected token “ in JSON at position 2
[{“id”:”aec817
…the quotation marks in front of id are marked with a red square.
Do you have any idea?
So I tried only to copy your “repair”-code into my function-node
what shows me multiple errors.
What version of node red do I need to use your code and example?
Best
Volker
LikeLike
Hi, try this JSON file, i m not sure where is problem, even i cant import shared flow but it looks ok.
https://drive.google.com/file/d/18AYr1vaq5ABllSOjbjF_hoTgIwkjhBxK/view?usp=sharing
LikeLike
HI Pavel
and thanks for your fast response. A few hours ago, i found the solution.
The problem are the quotation marks. If i copy and paste anything from this page to node-red the quotation marks are “converted” in some different version of quotation marks. They are looking nearly like yours, but they are not the same.
Maybe this is a problem with my german keyboard layout.
Once I found this Problem the solution was easy. I just deleted all ouf your quotation marks and typed them in again.
Perfekt – everything is running fine now and helped me a lot with my first steps in node-red and in programming the nodes.
Have a nice day
Volker
LikeLike
Hello, I’m trying to write a value from an home assistant enitiy to the influxdb. If I try your random value example above it works. But how can I write an actual measurement from an home assistant sensor i.e?
Shall I pull the current value via a node-red current state box before the function or can I in some way just define the msg.payload in the function box to be just: msg.payload = {temperature:my entity}; ?
I don’t really understand the full syntax yet so it could be really simple solution to this 🙂
LikeLike
Solved it by
var theval = msg.payload
msg.payload = {el_consump:theval};
return msg;
LikeLike
Hi Fredrik,
I found that working with InfluxDB on Home Assistant to be a little challenging. To allow me to view and manage InfluxDB I loaded the InfluxCLI (commandline client) on a separate PC.
To push an HA sensor value into InfluxDB you can use the NodeRed “current state” node. If you want to do a schedule write add a “BigTimer” node in front.
I hope that this helps.
Pete
LikeLike
Hi,
Have run a SQLite db and look for a way to use this
„The payload from the dropdown node would be something like: 1m, 5m, 15m. A Javascript function node (“New Time Scale”) used this payload and created an InfluxDB query.„
I don’t find an way to use select xxx xxxx where time > now() with SQLite.
Regards
LikeLike
Hi,
So if I understand you have adjustable time working. But you want a way to adjust the fields?
I might try to modify the payload format. In a Javascript function node:
msg.payload = {
“newtime”: “1m”,
“fields”: “myfield1,mfield2″,
}
return msg;
Note: the above is hardcoded to test, you’d pass in the field selection from from a selector.
Then in the 2nd function node:
msg.query=”select ” + msg.payload.fields + ” from mytable where ” time > now – ” + msg.payload.newtime
LikeLike
hi, thx.
but this will not work for sqlite
sqlite> select time,leistung from solarstrom where time > now -1 minute;
Error: near “minute”: syntax error
sqlite> select time,leistung from solarstrom where time > now -1min
…> ;
Error: unrecognized token: “1min”
sqlite> select time,leistung from solarstrom where time > now -1m;
Error: unrecognized token: “1m”
sqlite> select time,leistung from solarstrom where time > now -1;
Error: no such column: now
sqlite> select time,leistung from solarstrom where time > now -1h;
Error: unrecognized token: “1h”
sqlite> select time,leistung from solarstrom where time > now ‘-1h’;
Error: near “‘-1h'”: syntax error
sqlite> select time,leistung from solarstrom where time > now -1h;
Error: unrecognized token: “1h”
sqlite> select time,leistung from solarstrom where time > now -1 hour;
Error: near “hour”: syntax error
sqlite> select time,leistung from solarstrom where time > now – 1hour;
Error: unrecognized token: “1hour”
sqlite> select time,leistung from solarstrom where time > now – 1 hour;
Error: near “hour”: syntax error
sqlite> select time,leistung from solarstrom where time > now;
Error: no such column: now
I’ll look for this syntax at sqlite.
regards
LikeLike
Hi, This SQL statement is for InfluxDB.
See: https://sqlite.org/lang_datefunc.html
Section 4 has some Sqlite examples.
The date() and time() functions have modifiers that allow you to go ‘+’ or ‘-‘ from a specific time or from ‘now’.
LikeLike
Hi, thx.
Try to understand but nothing will work expected.
Regards
LikeLike